Biochar carbon removal (BCR) is one of the few durable removal pathways already delivering at scale. Built on mature pyrolysis technology, it now operates across many countries. Yet most durable CDR tonnes are contracted but still years from delivery, so buyers and investors increasingly ask who is actually delivering. Drawing on CDR.fyi data, this report examines biochar’s delivery record, the buyers and suppliers behind it, and what will sustain it as contracting grows.
Cross-Pathway Comparison: Biochar Leads in Carbon Removal Deliveries
Comparing cumulative contracted and delivered volumes reveals biochar carbon removal’s significant position in the durable carbon removal market. While BCR accounts for a smaller share of total contracted volumes, it dominates actual deliveries, highlighting its progress in project deployment and commercial execution.
| Key Metric | BCR | All Methods | BCR Share |
|---|---|---|---|
| Cumulative Contracted Volume | Approx. 7.448 million tonnes | Approx. 50.56 million tonnes | 14.7% |
| Cumulative Delivered Volume | 1.339 million tonnes | 1.711 million tonnes | 78.3% |
| Delivered-to-Contracted Volume Ratio | 18.0% | 3.38% | Approx. 5.3× the market average |
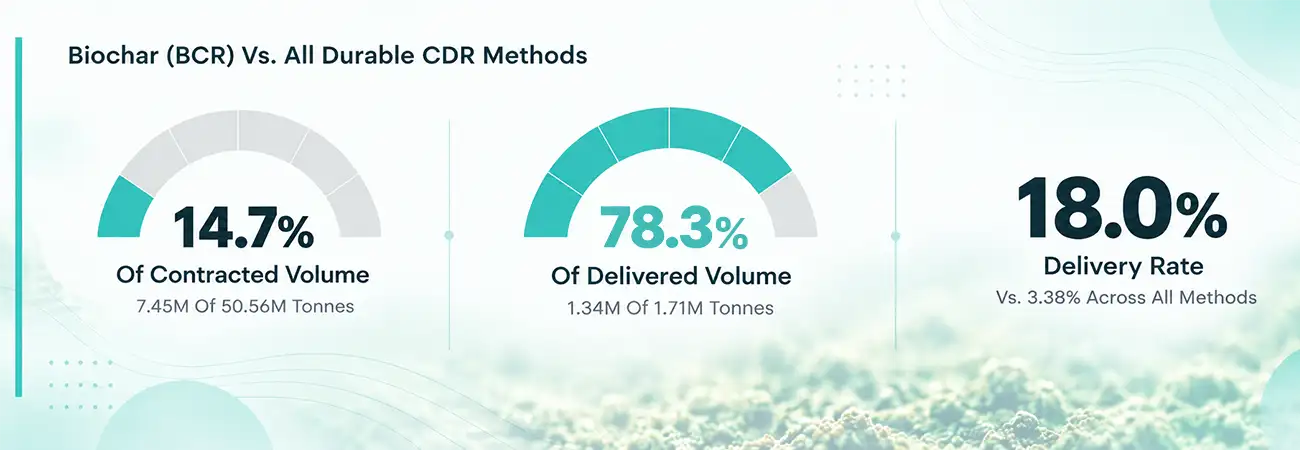
Data Insights: The gap between contracted and delivered volumes reveals not only BCR’s current market position but also differences in project execution and future growth potential across durable carbon removal pathways:
Contracted vs. Delivered
The gap between contracted volume and actual deliveries shows that procurement commitments do not translate into supply at the same pace. Delivery data offers a clearer view of project execution and commercial deployment.
Proven, Verifiable Process
Biochar’s delivery capacity rests on the industrial application of biochar equipment, and alignment between production data & MRV requirements. Together, these factors support replicable processes and verifiable carbon removal.
From Contracts to Scale
Long-term offtake agreements support project development and capacity expansion, but sustained growth depends on bringing new capacity online, maintaining reliable operations, and verifying carbon removal as contracted volumes increase.
Annual Growth: How Has Biochar CDR Delivery Evolved?
Annual delivery volumes reveal the growth trajectory of biochar carbon removal. Based on cumulative delivery data exported from CDR.fyi, annual volumes were calculated from year-on-year changes in cumulative totals.
| Year | Annual Deliveries |
|---|---|
| 2019 | 237 tonnes |
| 2020 | 1.24k tonnes |
| 2021 | 19.85k tonnes |
| 2022 | 60.40k tonnes |
| 2023 | 126.57k tonnes |
| 2024 | 407.42k tonnes |
| 2025 | 563.00k tonnes |
| 2026* | 160.72k tonnes |
Note: Annual volumes are derived from cumulative totals. The 2026 figure is partial-year data.
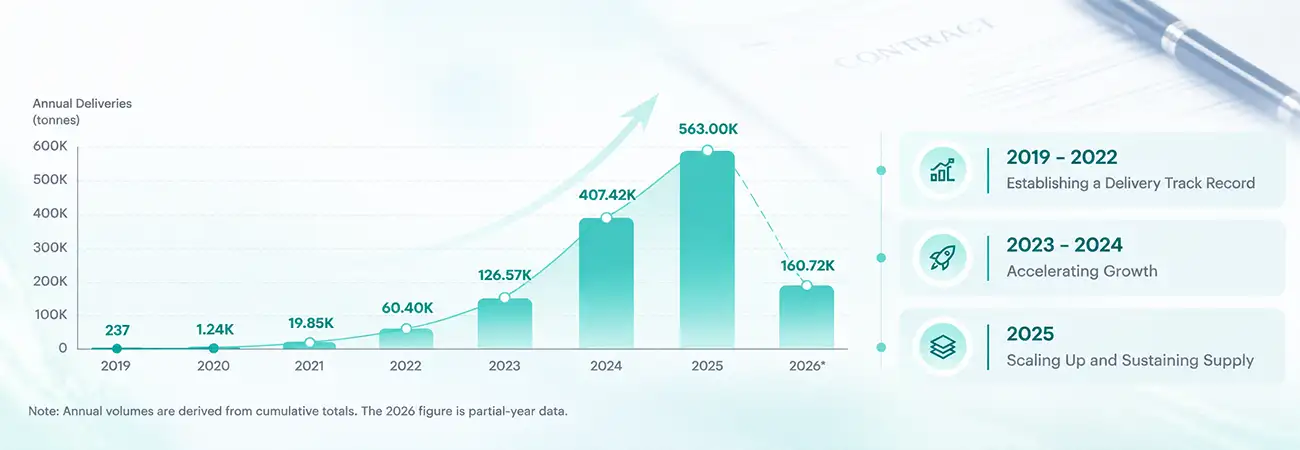
2019–2022: Establishing a Delivery Track Record
Biochar CDR deliveries rose steadily, reaching approximately 60,400 tonnes in 2022. The priority during this period was establishing a track record in project operations, carbon accounting, and credit delivery—key foundations for a viable commercial model.
2023–2024: Accelerating Growth
Annual deliveries reached 407.42k tonnes in 2024, up 222% year on year. Growth extended beyond contracts to actual deliveries, though annual totals alone cannot show whether expansion came from more suppliers, larger projects, or a few major contributors.
2025: Scaling Up and Sustaining Supply
Annual deliveries reached 563.00k tonnes in 2025, approximately 9.3 times the 2022 level. The low 2022 baseline partly explains this multiple, so it should not be used to project future growth. The next challenge is to broaden the project base and sustain annual supply.
3. Buyers and Suppliers: Who Is Driving the Biochar CDR Market?
The biochar carbon removal (BCR) market is taking shape around large buyers, leading project developers, and long-term offtake agreements. However, purchase commitments, contracted volumes, and actual deliveries reflect different stages of market development. Comparing buyer purchases, supplier contract volumes, and cumulative deliveries helps reveal demand concentration and suppliers’ ability to turn commercial opportunities into verified carbon removal.
Buyer Structure
| Rank | Buyer | Purchase Volume (K tonnes CO₂e) |
|---|---|---|
| 1 | Microsoft | 2,653.7 |
| 2 | Altitude | 1,630.0 |
| 3 | 300.0 | |
| 4 | Offset8 Capital | 178.1 |
| 5 | Swiss Re | 89.9 |

Concentrated Buyer Demand
Microsoft and Altitude account for 57.5% of contracted volume, showing the market’s reliance on a few buyers. Their purchasing decisions and offtake strategies may significantly influence project financing and capacity expansion. This concentration raises suppliers’ customer risk and does not necessarily indicate broad-based market demand.

Long-Term Offtake Agreements
In 2025, Microsoft and Exomad Green signed a 10-year offtake agreement for at least 1.24 million tonnes of CO₂e, supporting expansion. Long-term agreements give developers revenue visibility and help plan investment. However, an offtake is a future purchase commitment, not carbon removal already delivered or verified.
Supplier Structure
| Top 5 Suppliers by Contract Volume | ||
|---|---|---|
| Rank | Supplier | Contract Volume (K tonnes CO₂e) |
| 1 | Exomad Green | 2,423.4 |
| 2 | Liferaft | 1,003.0 |
| 3 | Varaha | 508.6 |
| 4 | Engrow | 425.0 |
| 5 | Alcom Carbon Markets | 360.7 |
| Top 5 Suppliers by Cumulative Deliveries | ||
|---|---|---|
| Rank | Supplier | Cumulative Deliveries (K tonnes CO₂e) |
| 1 | Exomad Green | 447.0 |
| 2 | Carboneers | 177.0 |
| 3 | Varaha | 174.8 |
| 4 | Aperam BioEnergia | 110.9 |
| 5 | Wakefield Biochar | 62.6 |

A Gap Between Contracts and Deliveries
Only Exomad Green and Varaha appear in both top-five rankings, so contract volume does not determine cumulative deliveries. Signing dates, delivery schedules, commissioning stages, and data definitions may affect rankings. Without contract-level, time-series delivery data, rankings cannot show a supplier’s fulfillment efficiency.

Delivery Capacity as a Competitive Factor
Contracted volume becomes carbon removal only after projects are built, run reliably, and complete delivery and verification. For expanding suppliers, ramp-up, feedstock security, equipment reliability, and MRV affect delivery timelines. Competitiveness depends on more than contract volume: deliveries must keep pace.
Market Insights
Demand Side: Long-Term Offtake Agreements
Long-term offtake agreements provide demand visibility, reducing sales uncertainty and supporting project financing and expansion. However, buyer concentration means growth may depend heavily on a few purchasers. Sustained growth also requires broader participation and continued purchasing from existing customers.
Supply Side: Scaled Delivery
The gap between contracted volumes and actual deliveries shows that market expansion cannot be measured by signed contracts alone. As more projects enter construction and operation, delivery data will matter more for judging whether planned capacity is coming online and commitments are becoming verifiable carbon removal.
Competitive Focus: Project Execution
As offtakes and large contracts strengthen the commercial base, differentiation will depend on execution. Equipment reliability, feedstock supply, operations, removal accounting, and third-party verification affect delivery. Suppliers that fulfill contracts and keep credible delivery records are likelier to win repeat purchases.
Cause Analysis: A Multi-Dimensional View of Delivery Growth
Biochar CDR delivery growth is not driven by a single factor. Technology, verification, deployment, and demand are interconnected, and together they form the foundation for delivery. The following is industry analysis, not a direct conclusion from order data.
1. Mature Pyrolysis Technology
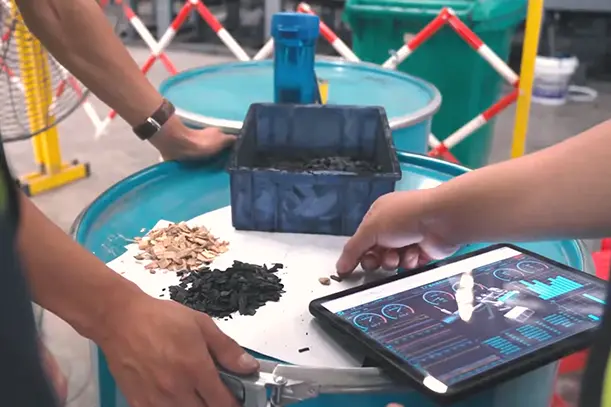
Biochar carbon removal is generally assessed at TRL 8–9, with hundreds of production plants operating worldwide (Source: Biochar Journal, 2024).
- Controllable production. Controlling temperature, residence time, and feed conditions allows continuous production and reduces swings in output and quality.
- Manageable product quality. Feedstock control and laboratory testing help manage verification indicators such as carbon content.
- Accumulating operating experience. Operating data can be used to optimize equipment configuration and inform expansion engineering.
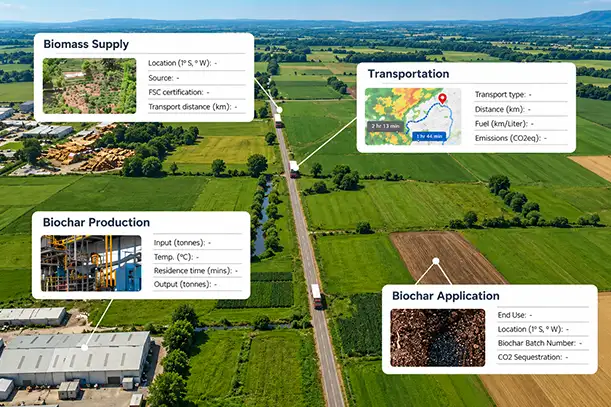
2. High Adaptability of dMRV
In pyrolysis production, feedstock input, operation, output, testing, and end use are clear data points that map to MRV requirements.
- Systems fit the process. dMRV system can be designed around feedstock input, operation, output, testing, and end-use tracking.
- Data maps to accounting. Production records, test results, and emissions data can be counted toward carbon removal under the applicable methodology.
- Planning starts at design. Coordinating equipment, data collection, and document management during construction reduces the risk of backfilling data after start-up.

3. Global Project Deployment
BCR projects now span many countries and regions, and Supercritical’s 2026 report assessed 119 biochar projects.
- Replicable engineering. Equipment configurations and operating experience from existing projects inform the design and commissioning of new ones.
- Ongoing local adaptation. Feedstock, energy costs, regulations, and end uses vary by location and require adjustments to a proven process.
- Evolving methodologies. Carbon removal registries can draw on practical experience to refine methodologies, improve accounting rules, and strengthen verification requirements.

4. Stable Demand Environment
Nearly 300 buyers have purchased biochar credits (CDR.fyi, Biochar Carbon Removal Market Snapshot, September 2025), and contracted volume reached about 3 Mt in H1 2026.
- Procurement demand guides capacity planning. Buyers’ demand for future carbon removal informs project scale and expansion pace.
- Long-term contracts support investment decisions. Clear delivery schedules improve revenue predictability and help with project financing and expansion.
- Sustained delivery builds commercial credibility. A fulfillment record provides a basis for later commercial cooperation.
Key Caveats: Technology maturity does not mean all projects deliver equally. dMRV integration and certification requirements vary by project and certifier. Buyer concentration is high, with the top two buyers accounting for 57.5% of biochar contracted volume, and Q3 2026 contracted volume declined. Signed volume does not equal actual deliveries, so contracts, deliveries, verification, and retirements should be distinguished when assessing the market.
Conclusion: Delivery Is the Measure That Matters
Biochar carbon removal accounts for 14.7% of contracted durable CDR volume but 78.3% of delivered volume, with an 18.0% delivery rate against 3.38% market-wide. Mature pyrolysis, verifiable data systems, replicable engineering, and long-term offtakes support this record, though concentration and uneven contracting remain. As the market matures, the question shifts from how much is contracted to how much is delivered and verified. Projects built for delivery and verification will lead.
Data source: CDR.fyi, as of October 2026.