As mandatory SAF blending rules are taking effect in the EU, the UK, and Singapore, aviation decarbonization ismoving from voluntary commitments to rigid constraints. Global SAF demand is expected to exceed 18 million tons by 2030, leaving a supply gap of about 6.8 million tons. Plastics-to-SAF can help fill this gap. Over 400 million tons of waste plastic are produced each year, and pyrolysis oil costs only $500–$750 per ton. The route offers both scale and cost advantages. This report covers the market insights, technology routes, challenges, and future trends of plastic-based SAF.
1. Industry Background & Global Market Overview
1.1 Aviation Decarbonization: From Voluntary to Mandatory Since 2025
Decarbonization Pressure on Aviation
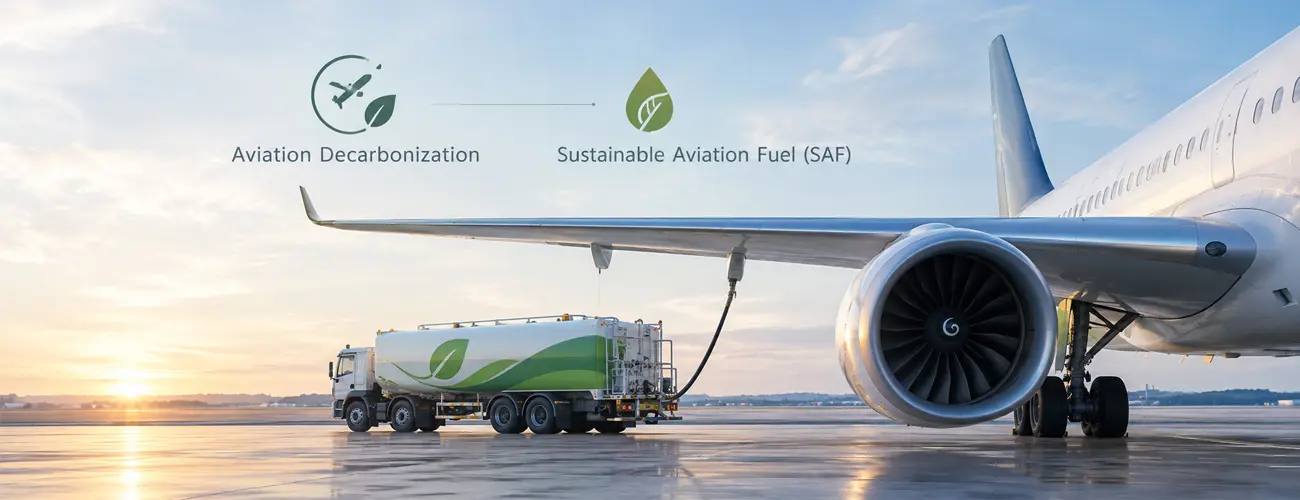
Global aviation accounts for about 2%–3% of human-caused carbon emissions. The International Air Transport Association (IATA) has pledged to reach net-zero emissions by 2050. SAF is currently the only decarbonization solution that can directly replace fossil jet fuel in existing aircraft engines and infrastructure, cutting life-cycle emissions by 50%–80%.
Mandatory Policy Driver
The EU’s ReFuelEU Aviation regulation took effect in January 2025, requiring fuel supplied at EU airports to contain at least 2% SAF. The UK has introduced a similar SAF mandate. Singapore will require 1% SAF for departing flights from 2026.
Widening Supply Gap
In 2025, global SAF production was about 1.9 million tonnes, only 0.6% of global jet fuel consumption. Based on policies and airline plans, global SAF demand will exceed 18 million tonnes by 2030, leaving a supply gap of 6.8 million tonnes. The supply side urgently needs breakthroughs in a wider range of technology pathways.
| Year | Policy & Market Milestones |
|---|---|
| 2025 | EU and UK 2% mandatory blend; global SAF output approx. 1.9 Mt |
| 2026 | Singapore 1% SAF target; global SAF output expected to reach 2.4 Mt |
| 2030 | EU 6% blend; global demand exceeds 18 Mt, gap approx. 6.8 Mt |
| 2040 | EU 34% blend, including a synthetic fuel sub-mandate |
| 2050 | EU 70% blend; aviation net-zero target |
Sources: IATA (updated December 2025); EU ReFuelEU Aviation Regulation (EU) 2023/2405; SkyNRG 2025 SAF Market Outlook
1.2 Market Size & Growth Drivers
Global SAF Market Reaches $2.25 Billion in 2026 and Is Set to Exceed $17 Billion by 2035, a 25.2% CAGR
1.8
2025
2.25
2026
4.0
2028E
6.5
2030E
10.5
2032E
17.0
2035E
Key Growth Drivers
- Policy mandates: The EU requires a 2% SAF blend from 2025, rising to 6% by 2030 and 70% by 2050. The UK and Singapore are following with their own mandates.
- Economic incentives: The US Section 45Z clean fuel credit offers SAF producers up to $1.00 per gallon from 2026, helping narrow the cost gap with fossil jet fuel.
- Airline commitments: More than 50 airlines have set SAF use targets for 2030, and IATA has pledged net-zero emissions by 2050.
Sources: Market Research Future (August 2026); Evolvance Market Research; IATA (updated December 2025).
2. Plastic-Derived SAF: Technology Pathways & Process Flow
2.1 Comparison of Mainstream SAF Routes
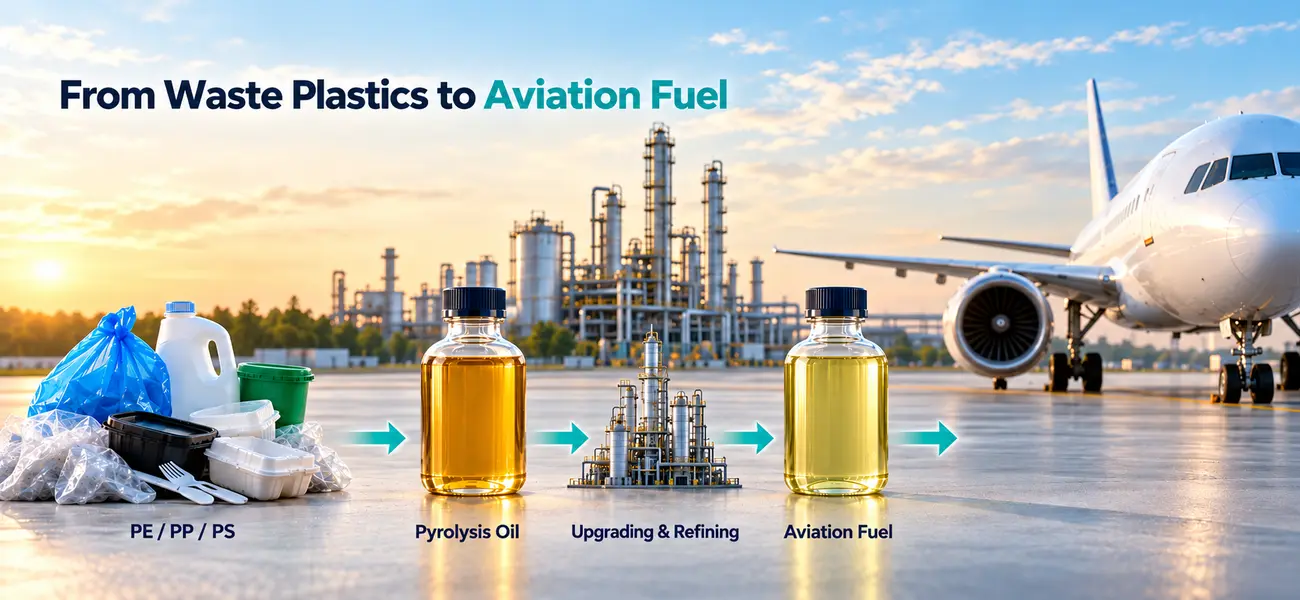
HEFA accounts for about 82% of global SAF capacity but is limited by feedstock supply. Upgrading plastic pyrolysis oil into SAF is the most promising emerging route. Its feedstock supply is almost unlimited, since global waste plastic exceeds 400 million tonnes a year. With its low production cost, pyrolysis oil is the only route that can address both plastic pollution and the SAF feedstock shortage.
| Route | Capacity share | Core feedstock | Maturity | Emission reduction | Main bottleneck |
|---|---|---|---|---|---|
| HEFA | ~82% | Used cooking oil, animal fats | TRL 9 | 50%–80% | Limited feedstock supply |
| FT synthesis | ~7.5% | Biomass, municipal solid waste | TRL 6–7 | 70%–90% | High capital intensity |
| ATJ | ~5% | Ethanol, lignocellulose | TRL 6–7 | 60%–80% | Conversion efficiency needs improvement |
| PtL | <1% | Green electricity, CO₂, water | TRL 5–6 | Close to 100% | High cost of green electricity |
| Plastic pyrolysis oil | Emerging | Waste plastics (PE/PP/PS) | TRL 5–7 | 50%–70% | Certification and quality consistency |
HEFA = hydroprocessed esters and fatty acids; FT = Fischer–Tropsch; ATJ = alcohol-to-jet; PtL = power-to-liquid; TRL = technology readiness level.
2.2 Core Steps from Waste Plastic to Jet Fuel
- Step 1: Sorting & Shredding: Sort PE/PP/PS, shred into uniform particles, and remove PVC and impurities.
- Step 2: Oxygen-Free Pyrolysis: Heat at 400–500 °C in an inert atmosphere (plastic pyrolysis machine) to break polymers into pyrolysis oil (PPO).
- Step 3: Purification & Fractionation: Remove sulfur, nitrogen, chlorine and metals, then separate naphtha, kerosene and diesel by carbon chain length.
- Step 4: Catalytic Hydro-Upgrading: Hydrocracking, isomerization and dechlorination convert pyrolysis oil into jet-fuel-grade hydrocarbons.
- Step 5: Fine Distillation: Precisely cut the C10–C15 jet fuel fraction and adjust freezing point, flash point and heating value.
- Step 6: Testing & Certification: Tested to ASTM D7566 and ISCC-certified, ready for direct blending.
| Process stage | Key parameters | Output / effect |
|---|---|---|
| Pyrolysis | Oxygen-free | Oil yield of 60%–92% |
| Fractional cutting | Cut by boiling point | Kerosene fraction (C10–C15) |
| Hydro-upgrading | H₂, pressure | Saturated hydrocarbons, impurities removed |
| Final product | Meets ASTM D7566 | Can be blended into jet fuel at up to 50% |
3. Global Market Landscape
European Union: Most Aggressive Policy, Most Certain Demand
2%
2025
6%
2030
20%
2035
34%
2040
52%
2045
70%
2050
Market Features
- Largest SAF Market: EU SAF demand was ~0.9 Mt in 2025; under-construction capacity will hit 3.2 Mt by 2030.
- Explicit Policy Support: The ReFuelEU Aviation regulation entered into force in January 2025 and sets progressively rising minimum blending mandates. Upgraded waste-plastic pyrolysis oil qualifies as Recycled Carbon Fuels (RCF) under the EU RED II framework.
Market assessment
The EU has the most aggressive SAF policy and the most certain demand, but its domestic capacity falls short. The clear supply gap in 2025–2030 gives external suppliers, including Chinese plastic-based SAF producers, an opportunity to export.
United States: Tax Incentives Drive Investment
| Emissions Reduction | Base Credit | With 45Z Bonus |
|---|---|---|
| ≥50% | $1.25/gal | $1.75/gal |
| ≥40% | $1.00/gal | $1.40/gal |
| ≥30% | $0.75/gal | $1.05/gal |
| ≥20% | $0.50/gal | $0.70/gal |
Market Features
- Voluntary Market Dominant: The U.S. has no federal blending mandate. SAF demand is driven mainly by voluntary airline purchases and state-level policies such as California’s LCFS.
- Plastic-to-SAF Pathway: Plastics-based SAF cuts emissions by 50%-70% and can earn the highest tier of credit, directly narrowing the cost gap with fossil jet fuel. Its economics are significantly better than in the European market.
Market assessment
Driven by IRA tax credits, the U.S. is the world’s most active SAF investment market, but demand is largely voluntary and HEFA/ATJ-based. Plastics-based SAF can earn the highest credit, making it a key differentiator.
Asia-Pacific and China: Policies Emerging, Strong Resource and Equipment Advantages
| Country/Region | Status | Details |
|---|---|---|
| Singapore | In effect | 1% SAF on all departing flights from 2026 |
| Japan | Under planning | Target of 10% SAF share by 2030 |
| South Korea | Under planning | Mandatory blending ratio legislation for 2030 in progress |
| India | Voluntary | 1% voluntary blending target from 2025 |
Market assessment
APAC SAF policy is just getting started, with Singapore the first to mandate. China has no national mandate yet, but offers three advantages: the largest waste plastic supply, leading pyrolysis equipment, and breakthrough atmospheric-pressure catalysis. Near term, it will focus on exports to Europe and voluntary domestic airline demand; once domestic policy lands, growth should surge.
4. Plastic-Based SAF Industrialization: Market Challenges
Certification and Standards Barriers
Plastic-based SAF must pass ASTM D7566 and ISCC sustainability certification. The pyrolysis oil route is not yet part of the mainstream certification pathway. Carbon accounting methods are not unified. Mutual recognition of certificates is also a barrier in cross-border trade.
Feedstock Quality and Stability
Waste plastics are a complex mix (PE/PP/PS/PVC). Chlorine and metal impurities vary widely. This makes pyrolysis oil quality unstable. It directly affects hydrotreating efficiency and final product consistency.
Cost Competitiveness Yet to Be Proven
Pyrolysis oil is cheap. But after adding hydrotreating, certification and logistics costs, full-chain SAF still costs 2–3 times as much as fossil jet fuel. It relies on policy subsidies and carbon revenue to be economically viable.
Insufficient Storage & Transport Infrastructure
SAF must be delivered through the existing jet fuel storage and transport system. But dedicated SAF facilities at airports are severely lacking. Infrastructure limits the blending ratio. Large-scale use faces a “last mile” bottleneck.
Policy Uncertainty & Competing Pathway Squeeze
SAF policies are still changing in many countries, and subsidies may be phased out. At the same time, HEFA capacity is expanding fast, and PtL costs are expected to fall over time. This squeezes plastic-based SAF. It needs to build a distinct advantage before 2030.
5. Future Trends
Trend 1: Accelerating Technology Cost Reduction
Catalyst Technology Breakthroughs
Single-atom catalysts and non-precious metal systems greatly cut hydrogenation costs. Atmospheric-pressure processes reduce spending on high-pressure equipment.
Larger-scale equipment
Production is moving from 1-ton-per-day pilot tests to 100-ton-per-day continuous processing. Economies of scale significantly lower unit costs.
Intelligent control
AI optimizes reaction parameters. This increases oil yield, improves product consistency, and lowers labor and energy costs.
Target
By 2030, the full-chain cost of plastic-based SAF falls to within RMB 8,000 per tonne, approaching the level of fossil jet fuel plus carbon price.
Trend 2: Global Policy Convergence
Expanding mandatory blending
Mandates are spreading from the EU and UK to Singapore, Japan, South Korea, Canada, and Australia. Major aviation markets worldwide are expected to introduce mandatory policies by 2030.
Unified certification standards
Certification systems such as ISCC and RSB are gradually moving toward mutual recognition, and carbon accounting methodologies are converging, lowering barriers to cross-border trade.
Plastic-based fuels entering the mainstream
The pyrolysis oil pathway is expected to be added to the ASTM D7566 annex, gaining certification status on par with HEFA.
Expected Chinese policy
During the 15th Five-Year Plan period, a nationwide SAF blending target and subsidy policy are expected to be introduced.
Trend 3: Deepening Value Chain Collaboration
Cross-sector cooperation
Energy majors, environmental companies, airlines, and plastic recycling firms form a four-way collaboration, binding the full chain from feedstock to end use.
Refinery co-processing
More and more refineries use pyrolysis oil as feedstock, producing SAF with existing hydrotreating units and reducing investment in new capacity.
Long-term offtake agreements
Airlines sign 10–15-year offtake agreements (OBA) with producers, locking in demand and price and reducing investment risk.
Joint infrastructure construction
Airports, oil companies, and governments jointly invest in SAF storage and transport facilities, breaking the “last mile” bottleneck.
Future Look
Plastic-based SAF turns a mounting waste problem into a low-carbon aviation fuel. Advances in pyrolysis equipment, falling catalytic costs, tightening mandates, and deeper cross-sector cooperation are moving the industry from pilot projects toward commercial scale. Early movers who secure feedstock, certification, and long-term offtake partners will be best positioned as global demand accelerates toward 2030.